On this page you will find synoptic weather map interpretation Grade 12 Notes.
To better understand weather patterns and weather phenomena you need to be able to interpret the synoptic weather map.
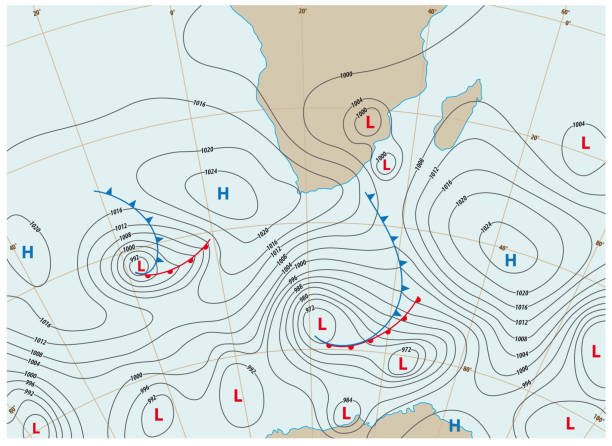
A synoptic weather map shows weather conditions and phenomena (temperature, precipitation,wind speed and direction, atmospheric pressure and cloud coverage) over a wide area at a given time based on worldwide observations recorded at the same time (from weather stations, airplanes, weather balloons and satellites).
Understanding isobars
Isobars are lines on a weather map joining together places of equal atmospheric pressure.
- These lines join points of equal pressure (all along one isobar the pressure is the same).
- The pressure is measured in hectopascals (hpa)/millibars (mb).
- The isobars form patterns (shapes formed by many isobars).
Synoptic Weather Map Exam Tips

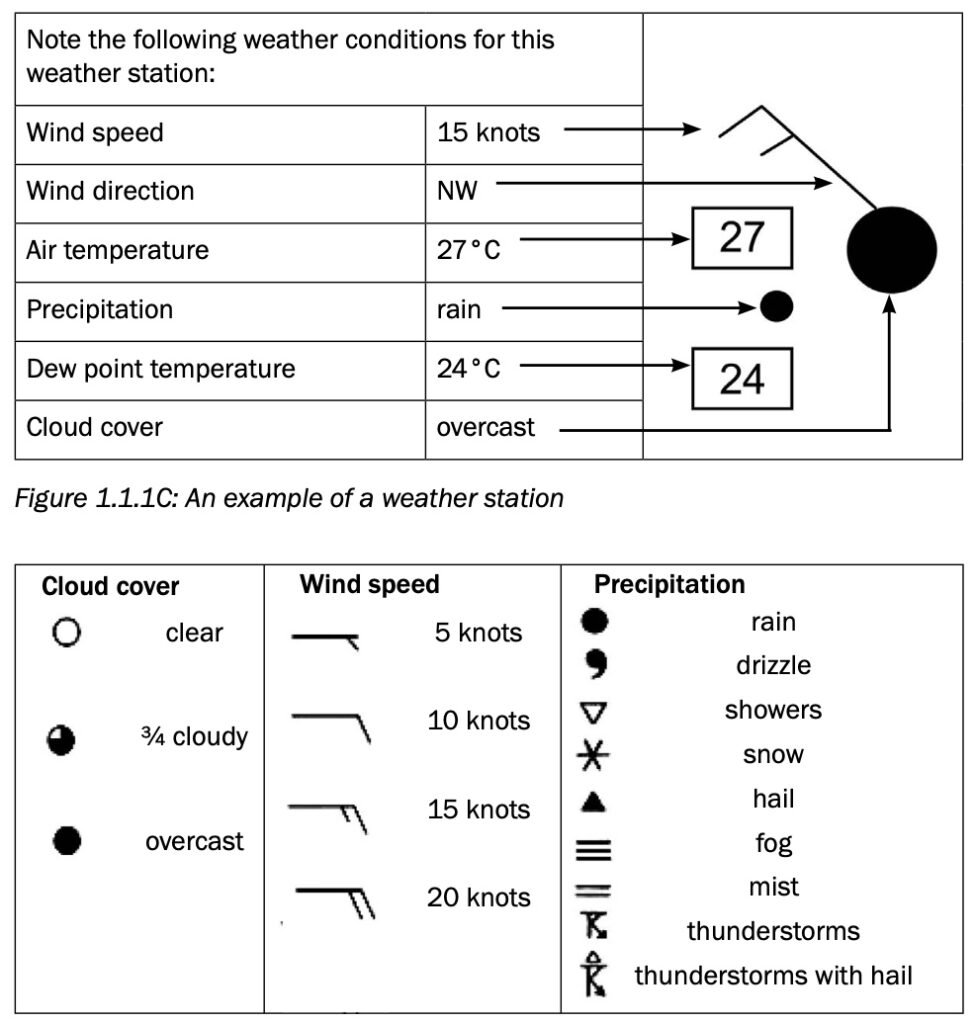
In the exam, you may be asked to describe the weather of a particular place on the synoptic weather map by referring to the weather station. You will need to comment on the following weather elements:
- Cloud cover interpretation
- Wind direction interpretation
- Wind speed interpretation
- Air temperature interpretation
- Dew point temperature interpretation
- Precipitation (any form of water falling from the sky, e.g. rain, hail,snow and ice) interpretations.
Video Lesson:
Important Weather symbols: Match weather symbols to words
In the Geography Grade 12 exam, you may be asked to match weather symbols to words. Below are the most common weather symbols that grade 12 learners should know:

Synoptic weather map interpretation Grade 12 pdf notes for downloads

View all #Geography-Grade 12 Study Resources
We have compiled great resources for Geography Grade 12 students in one place. Find all Question Papers, Notes, Previous Tests, Annual Teaching Plans, and CAPS Documents.


