Annual rainfall graphs of the past five years in South Africa from 2021 – 2017:
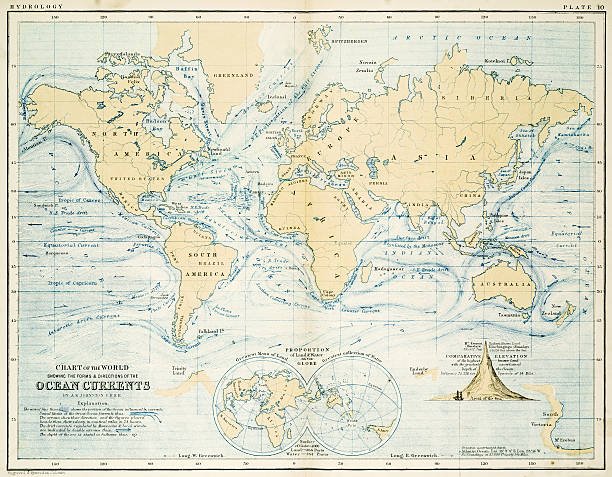
South Africa has a diverse climate, ranging from desert and semi-desert in the west, to sub-tropical conditions on the eastern coastline. The rainfall pattern over South Africa is primarily influenced by the movement of frontal systems across the southern oceans, tropical-temperate troughs, and the movement of moisture from the Indian and Atlantic Oceans. Between 2017 and 2021, the annual rainfall in South Africa has shown an increasing trend, as per the data provided.
NB: This is for guidance purposes ONLY. Learners should consult their prescribed learning material as a primary for any school assessments. Our content is not a prescribed memorandum, but a general knowledge.
Possible Reasons for Increasing Rainfall in South Africa
- Climate Change: Climate change is altering weather patterns around the globe. Increasing global temperatures can lead to increased evaporation and consequently, more moisture in the atmosphere. This can result in more intense rainfall events.
- El Niño-Southern Oscillation (ENSO) Cycle: The ENSO cycle can significantly influence rainfall in South Africa. La Niña phase of the cycle typically brings wetter conditions to the region, while El Niño often results in drier conditions. Variations in the ENSO cycle might have contributed to the observed increase in rainfall.
- Indian Ocean Dipole (IOD): The IOD refers to the temperature difference between the western and eastern parts of the Indian Ocean. Changes in the IOD can influence the amount of rainfall that South Africa receives.
- Changes in Antarctic Sea Ice: Antarctic sea ice can influence the path and intensity of storm systems moving across the Southern Ocean towards South Africa. Changes in sea ice could potentially impact rainfall patterns in South Africa.
- Anthropogenic Factors: Human activities such as deforestation or afforestation, urbanization, and changes in land use can alter local weather patterns and potentially increase rainfall.
It’s important to note that while these factors can influence rainfall patterns, climate and weather are highly complex systems influenced by a myriad of factors. To determine the precise reasons for the increase in rainfall observed in South Africa from 2017 to 2021, detailed scientific studies would need to be conducted. These would likely involve climatologists using complex climate models to analyze various data and tease apart the relative impacts of different factors.
Annual rainfall graphs of the past five years in South Africa
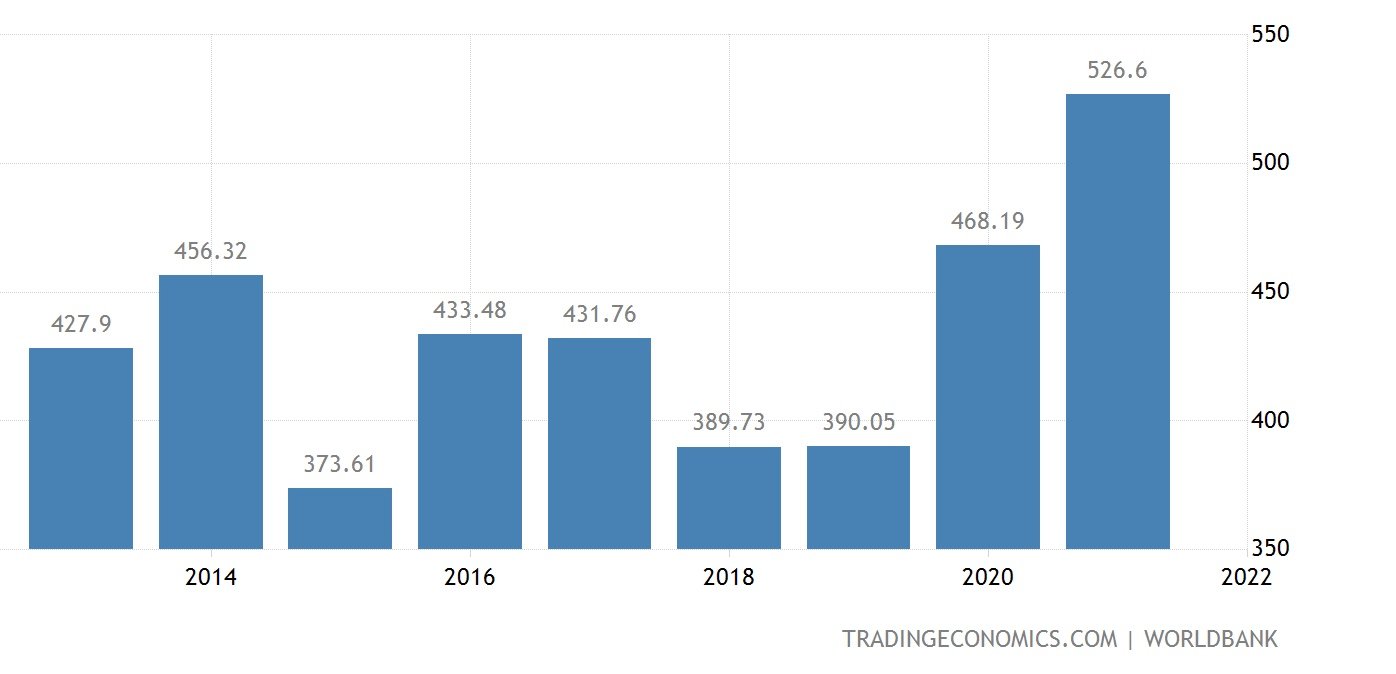
The numbers you’ve provided represent the annual rainfall totals in millimeters (mm) for South Africa from 2017 to 2021. Here’s a brief analysis of the data:
- 2017: The annual rainfall for the year was 431.76 mm. This would serve as our base year for comparison.
- 2018: The annual rainfall slightly decreased to 389.73 mm. This would indicate a drier year compared to 2017, with a decrease of about 9.7%.
- 2019: The annual rainfall was 390.05 mm, virtually the same as in 2018, indicating another year with relatively low rainfall.
- 2020: The annual rainfall increased to 468.19 mm. This is an increase of approximately 20% from the previous year, indicating a wetter year compared to 2018 and 2019.
- 2021: The annual rainfall increased further to 526.6 mm. This is the highest rainfall total in the five-year period, and it’s about 12.4% higher than 2020’s total.
This analysis shows a trend of increasing annual rainfall in South Africa from 2018 to 2021. Such trends could be influenced by various factors, including changes in global climate patterns, local weather phenomena, or even shifts in oceanic currents and temperatures. However, to fully understand the reasons behind these changes, a more detailed climatological study would be needed.
Remember, while this data might suggest a trend, climate is complex and varies greatly from year to year. It’s important to look at long-term patterns (over many decades) to understand true climate trends.
Geography Resources
- A map of South Africa, that indicates the drought-stricken areas
- Annual rainfall graphs of the past five years
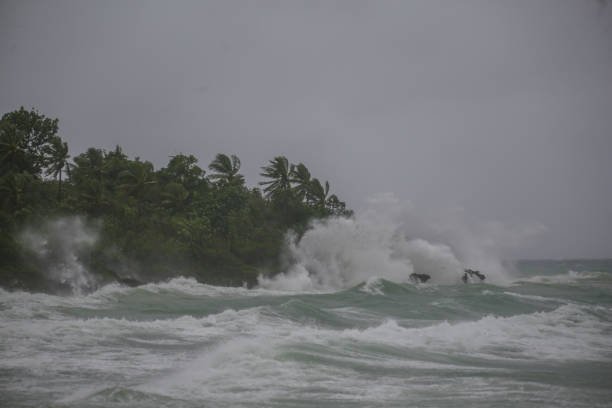
- Pictures of the different types of droughts
- A brief discussion on the annual rainfall graphs
- How can droughts be triggered by Physical (natural) conditions
- How can droughts be triggered by Human activities
- Outline the negative impact of droughts on the economy of South Africa
- Outline the negative impact of droughts on the farmers of South Africa
- Discuss drought prevention and drought preparation strategies
- What is the relationship between climate change and the regularity of droughts
- What is the way forward regarding droughts for the government and the people of South Africa
Get Free Help for Your Assignment Today
Click the Button Below: